import os
import matplotlib.pyplot as plt
import numpy as np

# High DPI rendering for mac
%config InlineBackend.figure_format = 'retina'
%config InlineBackend.print_figure_kwargs={'facecolor' : "w"}

plot_params = {
'font.size' : 22,
'axes.titlesize' : 24,
'axes.labelsize' : 20,
'axes.labelweight' : 'bold',
'xtick.labelsize' : 16,
'ytick.labelsize' : 16,
}

plt.rcParams.update(plot_params)
# Make dataset
X = np.linspace(0,5,200)
Y = 1.3*X + np.random.normal(0.01, size=X.shape)Quick plotting
fig, ax = plt.subplots(1,1, figsize=(8,8))
ax.scatter(X, Y)
ax.set_xlabel('X')
ax.set_ylabel('Y')
Text(0, 0.5, 'Y')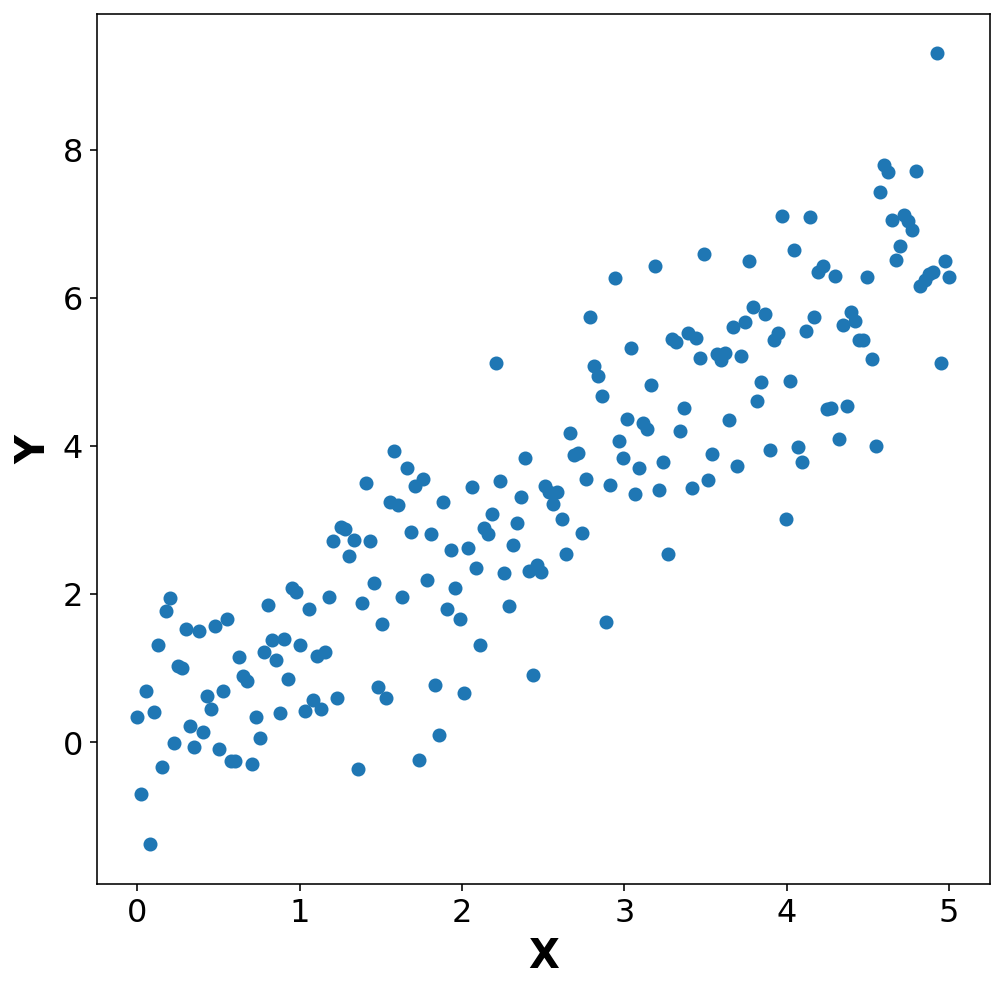
Make plots with equal aspect ratio and axes
fig, ax = plt.subplots(1,1, figsize=(8,8))
ax.scatter(X, Y, label='data')

# Find limits for each axes
lims = [np.min([ax.get_xlim(), ax.get_ylim()]),  # min of both axes
        np.max([ax.get_xlim(), ax.get_ylim()]),  # max of both axes
       ]

ax.plot(lims, lims, 'k--', alpha=0.75, zorder=0, label='parity')
ax.set_aspect('equal')

ax.set_xlim(lims)
ax.set_ylim(lims)

ax.set_xlabel('X')
ax.set_ylabel('Y')

handles, labels = ax.get_legend_handles_labels()
print(labels)
ax.legend(handles=handles, labels=labels, title="Legend")
['parity', 'data']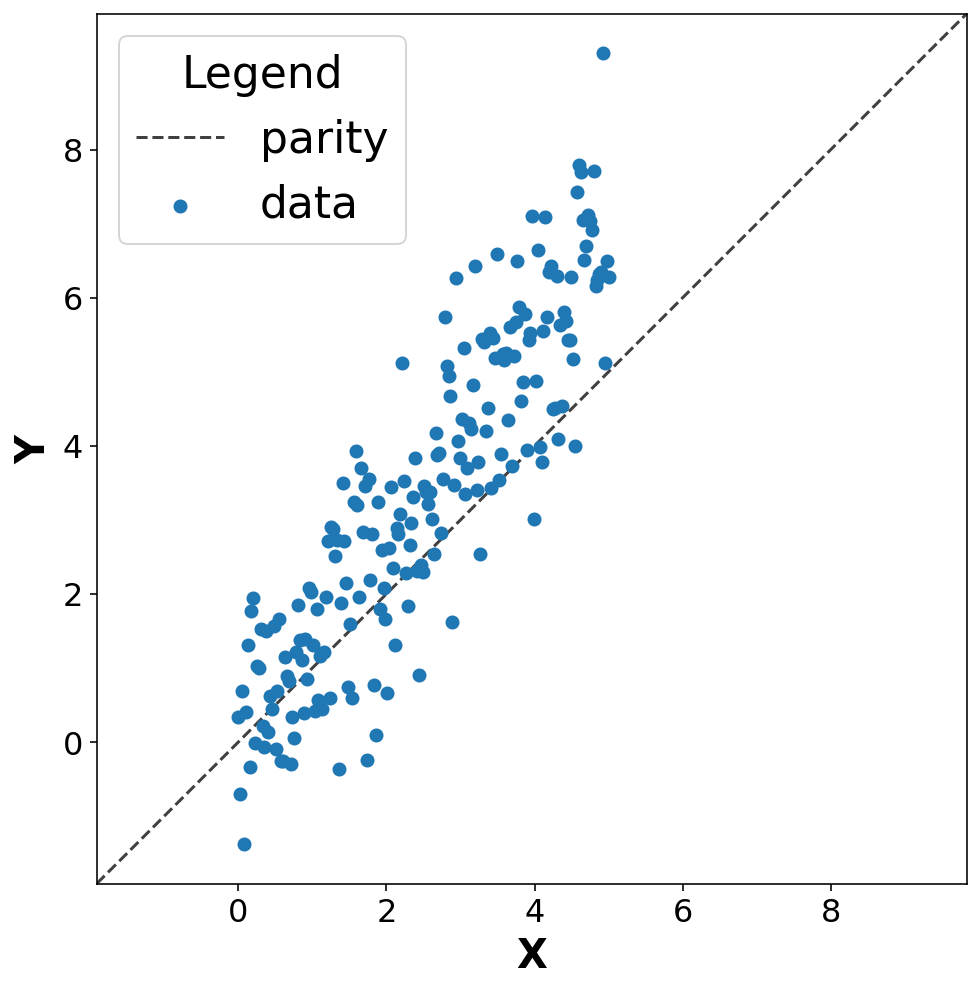
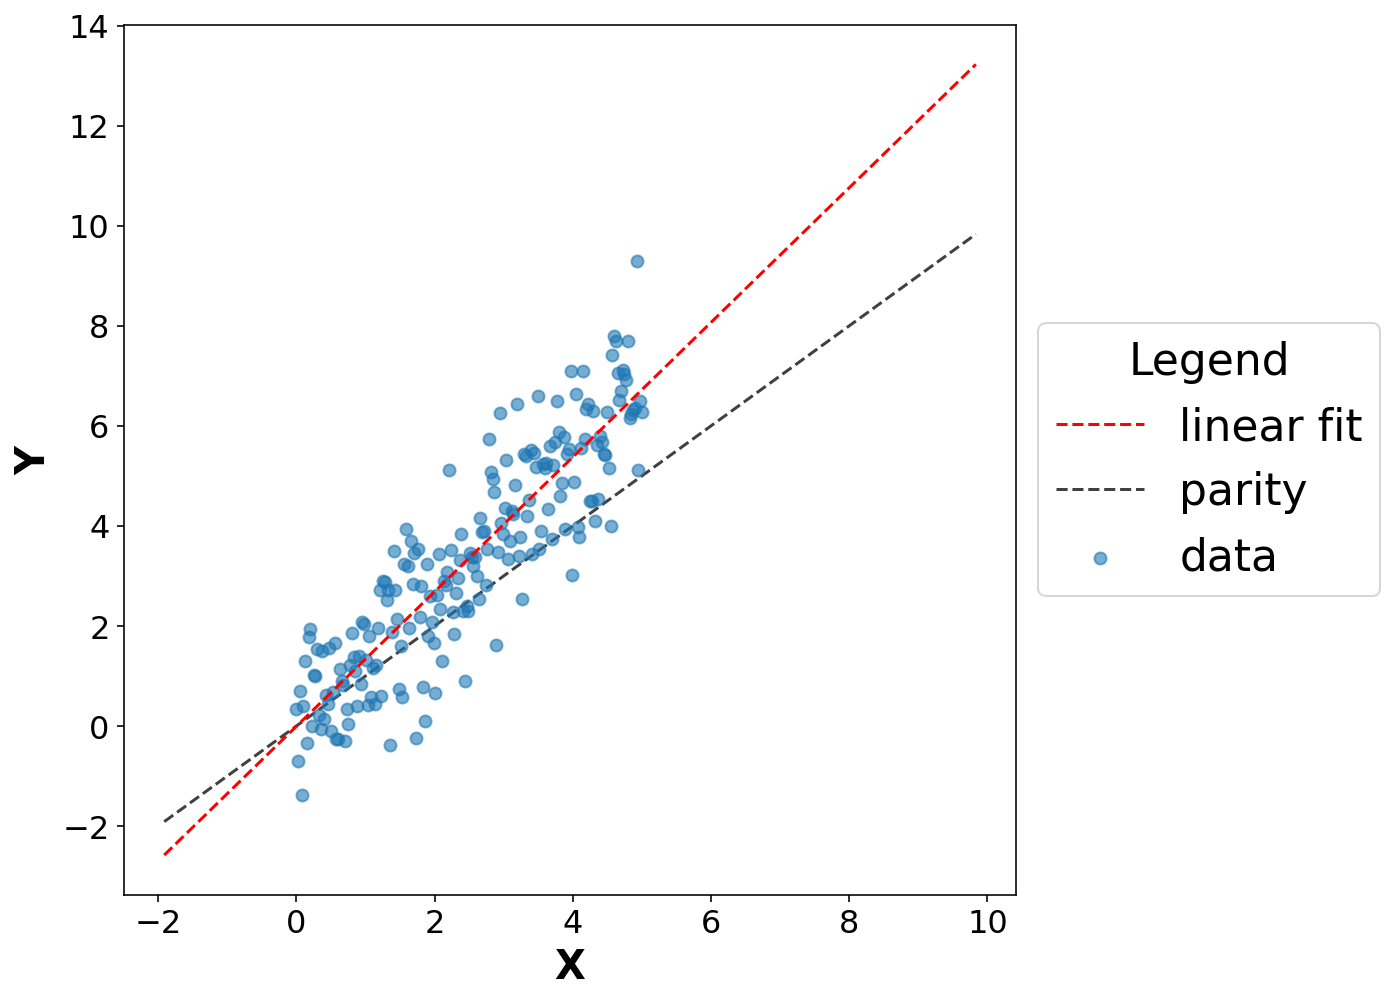
Slightly fancier output with parity and linear fit plots
fig, ax = plt.subplots(1,1, figsize=(8,8))
ax.scatter(X, Y, alpha=0.6, label='data')

lims = [np.min([ax.get_xlim(), ax.get_ylim()]),  # min of both axes
        np.max([ax.get_xlim(), ax.get_ylim()]),  # max of both axes
        ]

# Linear fit line
reg = np.polyfit(X, Y, deg=1)
ax.plot(lims, reg[0] * np.array(lims) + reg[1], 'r--', linewidth=1.5, label='linear fit')

# Parity plot
ax.plot(lims, lims, 'k--', alpha=0.75, zorder=0, label='parity')
#ax.set_aspect('equal')

ax.set_xlabel('X')
ax.set_ylabel('Y')

handles, labels = ax.get_legend_handles_labels()
print(labels)

# Put a legend to the right of the current axis
ax.legend(handles=handles, labels=labels, title="Legend", loc='center left', bbox_to_anchor=(1, 0.5))
['linear fit', 'parity', 'data']